here an old post
http://sensomusic.com/forums/viewtopic.php?id=2223
dont try my exemple! completely out!
but senso talked about an array to pixel
Statistics: Posted by headphoner — 28 Jun 2011, 22:11
]]>
]]>
Statistics: Posted by nay-seven — 28 Jun 2011, 16:10
]]>
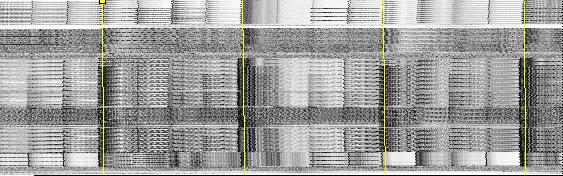
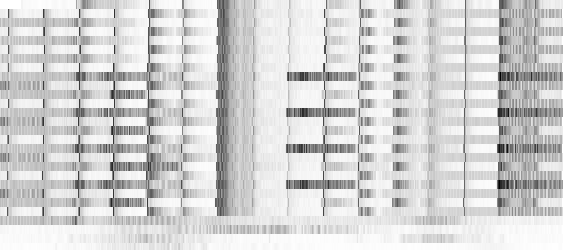
would it be possible to generate a time-varying spectral representation(spectrogram) in usine? i am thinking of something like this:
overview:
detail intro:
screencast (a bit laggy but should do the trick. the small white square represents the playbar.):
http://screencast-o-matic.com/watch/cX1uXMqKO
those images were generated with JacksonDj, which uses this approach to visually beat-map audio material.
that way, it's really easy to locate audio events, loops and structures within the spectrogram. combined with a simple tagging system and some looping abilities, this could really provide an interesting workflow. i've always found the "traditional" waveform display( amplitude (loudness) over time) rather useless, when it comes to structural analysis of audio material.it will be visualized in the analysis window as if it were a music score. The song goes from left to right and a new line is begun every new measure. The width of the measures depends on the tempo and the number of beats per measure set by the user.
what i'm after, is some kind of unobtrusive visual audio tool for re-editing audio..NO spectral manipulation..basically a representation layer(spectrogram) and some sort of behaviour layer for playing and tagging..
bits and pieces are spread all over the forum, like 23fx23s Loop Masher and nay-sevens Draw_Sequence..
any thoughts/guides/ready-mades
cheers,
io
Statistics: Posted by iococoi — 28 Jun 2011, 15:13
]]>